17 KiB
layout, title, date, categories, highlight
| layout | title | date | categories | highlight | |
|---|---|---|---|---|---|
| post | Step 3: Observability (LGTM, KSM) | 2025-12-28 07:00:00 -0400 |
|
true |
3. Observability: The LGTM Stack
In a distributed cluster, logs and metrics are scattered across different pods and nodes. We centralized monitoring using the LGTM Stack (Loki, Grafana, Prometheus) plus Kube State Metrics and the Prometheus Adapter to centralize our logs and metrics.
3.1 The Databases (StatefulSets)
- Prometheus: Scrapes metrics. We updated the config to scrape Kube State Metrics via its internal DNS Service.
- Loki: Aggregates logs. Configured with a 168h (7-day) retention period.
infra/observer/prometheus.yaml
# Configuration
apiVersion: v1
kind: ConfigMap
metadata:
  name: prometheus-config
  namespace: monitoring
data:
  prometheus.yml: |
    global:
      scrape_interval: 15s
      evaluation_interval: 15s
    storage:
      tsdb:
        out_of_order_time_window: 1m

    scrape_configs:
      # 1. Scrape Prometheus itself (Health Check)
      - job_name: 'prometheus'
        static_configs:
          - targets: ['localhost:9090']

      # 2. Scrape Kube State Metrics (KSM)
      # We use the internal DNS: service-name.namespace.svc.cluster.local:port
      - job_name: 'kube-state-metrics'
        static_configs:
          - targets: ['kube-state-metrics.monitoring.svc.cluster.local:8080']

---
# Service
apiVersion: v1
kind: Service
metadata:
  name: prometheus
  namespace: monitoring
spec:
  type: ClusterIP
  selector:
    app: prometheus
  ports:
    - port: 9090
      targetPort: 9090

---
# The Database (StatefulSet)
apiVersion: apps/v1
kind: StatefulSet
metadata:
  name: prometheus
  namespace: monitoring
spec:
  serviceName: prometheus
  replicas: 1
  selector:
    matchLabels:
      app: prometheus
  template:
    metadata:
      labels:
        app: prometheus
    spec:
      containers:
        - name: prometheus
          image: prom/prometheus:latest
          args:
            - '--config.file=/etc/prometheus/prometheus.yml'
            - '--web.enable-remote-write-receiver'
            - '--storage.tsdb.path=/prometheus'
            - '--web.console.libraries=/usr/share/prometheus/console_libraries'
            - '--web.console.templates=/usr/share/prometheus/consoles'
          ports:
            - containerPort: 9090
          volumeMounts:
            - name: config
              mountPath: /etc/prometheus
            - name: data
              mountPath: /prometheus
      volumes:
        - name: config
          configMap:
            name: prometheus-config
  volumeClaimTemplates:
    - metadata:
        name: data
      spec:
        accessModes: ['ReadWriteOnce']
        storageClassName: 'openebs-hostpath'
        resources:
          requests:
            storage: 5Gi
infra/observer/loki.yaml
# --- Configuration ---
apiVersion: v1
kind: ConfigMap
metadata:
  name: loki-config
  namespace: monitoring
data:
  local-config.yaml: |
    auth_enabled: false
    server:
      http_listen_port: 3100
    common:
      path_prefix: /loki
      storage:
        filesystem:
          chunks_directory: /loki/chunks
          rules_directory: /loki/rules
      replication_factor: 1
      ring:
        instance_addr: 127.0.0.1
        kvstore:
          store: inmemory
    schema_config:
      configs:
        - from: 2020-10-24
          store: tsdb
          object_store: filesystem
          schema: v13
          index:
            prefix: index_
            period: 24h

---
# --- Storage Service (Headless) ---
# Required for StatefulSets to maintain stable DNS entries.
apiVersion: v1
kind: Service
metadata:
  name: loki
  namespace: monitoring
spec:
  type: ClusterIP
  selector:
    app: loki
  ports:
    - port: 3100
      targetPort: 3100
      name: http-metrics

---
# --- The Database (StatefulSet) ---
apiVersion: apps/v1
kind: StatefulSet
metadata:
  name: loki
  namespace: monitoring
spec:
  serviceName: loki
  replicas: 1
  selector:
    matchLabels:
      app: loki
  template:
    metadata:
      labels:
        app: loki
    spec:
      containers:
        - name: loki
          image: grafana/loki:latest
          args:
            - -config.file=/etc/loki/local-config.yaml
          ports:
            - containerPort: 3100
              name: http-metrics
          volumeMounts:
            - name: config
              mountPath: /etc/loki
            - name: data
              mountPath: /loki
      volumes:
        - name: config
          configMap:
            name: loki-config
  # Persistent Storage
  volumeClaimTemplates:
    - metadata:
        name: data
      spec:
        accessModes: ['ReadWriteOnce']
        storageClassName: 'openebs-hostpath'
        resources:
          requests:
            storage: 5Gi
3.2 The Bridge: Prometheus Adapter & KSM
Standard HPA only understands CPU and Memory. To scale on Requests Per Second, we needed two extra components.
Helm (Package Manager)
You will notice kube-state-metrics and prometheus-adapter are missing from our file tree. That is because we install them using Helm. Helm allows us to install complex, pre-packaged applications ("Charts") without writing thousands of lines of YAML. We only provide a values.yaml file to override specific settings.
- Kube State Metrics (KSM): A service that listens to the Kubernetes API and generates metrics about the state of objects (e.g.,
kube_pod_created). - Prometheus Adapter: Installs via Helm. We use
infra/observer/adapter-values.yamlto configure how it translates Prometheus queries into Kubernetes metrics.
infra/observer/adapter-values.yaml
prometheus:
  url: http://prometheus.monitoring.svc.cluster.local
  port: 9090

rules:
  custom:
    - seriesQuery: 'nginx_http_requests_total{pod!="",namespace!=""}'
      resources:
        overrides:
          namespace: { resource: 'namespace' }
          pod: { resource: 'pod' }
      name:
        matches: '^(.*)_total'
        as: 'nginx_http_requests_total'
      metricsQuery: 'rate(<<.Series>>{<<.LabelMatchers>>}[1m])'
3.3 The Agent: Grafana Alloy (DaemonSets)
We need to collect logs from every node in the cluster.
- DaemonSet vs. Deployment: A Deployment ensures n replicas exist somewhere. A DaemonSet ensures exactly one Pod runs on every Node. This is perfect for infrastructure agents (logging, networking, monitoring).
- Downward API: We need to inject the Pod's own name and namespace into its environment variables so it knows "who it is."
infra/alloy-env.yaml
apiVersion: v1
kind: ConfigMap
metadata:
  name: monitoring-env
  namespace: monitoring
data:
  LOKI_URL: 'http://loki.monitoring.svc:3100/loki/api/v1/push'
  PROM_URL: 'http://prometheus.monitoring.svc:9090/api/v1/write'
infra/alloy-setup.yaml
# --- RBAC configuration ---
apiVersion: v1
kind: ServiceAccount
metadata:
  name: alloy-sa
  namespace: monitoring

---
apiVersion: rbac.authorization.k8s.io/v1
kind: ClusterRole
metadata:
  name: alloy-cluster-role
rules:
  # 1. Standard API Access
  - apiGroups: ['']
    resources: ['nodes', 'nodes/proxy', 'services', 'endpoints', 'pods']
    verbs: ['get', 'list', 'watch']
  # 2. ALLOW METRICS ACCESS (Crucial for cAdvisor/Kubelet)
  - apiGroups: ['']
    resources: ['nodes/stats', 'nodes/metrics']
    verbs: ['get']
  # 3. Log Access
  - apiGroups: ['']
    resources: ['pods/log']
    verbs: ['get', 'list', 'watch']
  # 4. Non-Resource URLs (Sometimes needed for /metrics endpoints)
  - nonResourceURLs: ['/metrics']
    verbs: ['get']

---
apiVersion: rbac.authorization.k8s.io/v1
kind: ClusterRoleBinding
metadata:
  name: alloy-cluster-binding
roleRef:
  apiGroup: rbac.authorization.k8s.io
  kind: ClusterRole
  name: alloy-cluster-role
subjects:
  - kind: ServiceAccount
    name: alloy-sa
    namespace: monitoring

---
# --- Alloy pipeline configuration ---
apiVersion: v1
kind: ConfigMap
metadata:
  name: alloy-config
  namespace: monitoring
data:
  config.alloy: |
    // 1. Discovery: Find all pods
    discovery.kubernetes "k8s_pods" {
      role = "pod"
    }

    // 2. Relabeling: Filter and Label "severed-blog" pods
    discovery.relabel "blog_pods" {
      targets = discovery.kubernetes.k8s_pods.targets

      rule {
        action = "keep"
        source_labels = ["__meta_kubernetes_pod_label_app"]
        regex = "severed-blog"
      }

      // Explicitly set 'pod' and 'namespace' labels for the Adapter
      rule {
        action = "replace"
        source_labels = ["__meta_kubernetes_pod_name"]
        target_label = "pod"
      }

      rule {
        action = "replace"
        source_labels = ["__meta_kubernetes_namespace"]
        target_label = "namespace"
      }

      // Route to the sidecar exporter port
      rule {
        action = "replace"
        source_labels = ["__address__"]
        target_label = "__address__"
        regex = "([^:]+)(?::\\d+)?"
        replacement = "$1:9113"
      }
    }

    // 3. Direct Nginx Scraper
    prometheus.scrape "nginx_scraper" {
      targets = discovery.relabel.blog_pods.output
      forward_to = [prometheus.remote_write.metrics_service.receiver]
      job_name   = "integrations/nginx"
    }

    // 4. Host Metrics (Unix Exporter)
    prometheus.exporter.unix "host" {
      rootfs_path = "/host/root"
      sysfs_path  = "/host/sys"
      procfs_path = "/host/proc"
    }

    prometheus.scrape "host_scraper" {
      targets    = prometheus.exporter.unix.host.targets
      forward_to = [prometheus.remote_write.metrics_service.receiver]
    }

    // 5. Remote Write: Send to Prometheus
    prometheus.remote_write "metrics_service" {
      endpoint {
        url = sys.env("PROM_URL")
      }
    }

    // 6. Logs Pipeline: Send to Loki
    loki.source.kubernetes "pod_logs" {
      targets    = discovery.relabel.blog_pods.output
      forward_to = [loki.write.default.receiver]
    }

    loki.write "default" {
      endpoint {
        url = sys.env("LOKI_URL")
      }
    }

    // 7. Kubelet Scraper (cAdvisor for Container Metrics)
    discovery.kubernetes "k8s_nodes" {
      role = "node"
    }

    prometheus.scrape "kubelet_cadvisor" {
      targets = discovery.kubernetes.k8s_nodes.targets
      scheme  = "https"
      metrics_path = "/metrics/cadvisor"
      job_name     = "integrations/kubernetes/cadvisor"

      tls_config {
        insecure_skip_verify = true
      }
      bearer_token_file = "/var/run/secrets/kubernetes.io/serviceaccount/token"

      forward_to = [prometheus.remote_write.metrics_service.receiver]
    }

---
# --- Agent Deployment (DaemonSet) ---
apiVersion: apps/v1
kind: DaemonSet
metadata:
  name: alloy
  namespace: monitoring
spec:
  selector:
    matchLabels:
      name: alloy
  template:
    metadata:
      labels:
        name: alloy
    spec:
      serviceAccountName: alloy-sa
      hostNetwork: true
      hostPID: true
      dnsPolicy: ClusterFirstWithHostNet
      containers:
        - name: alloy
          image: grafana/alloy:latest
          args:
            - run
            - --server.http.listen-addr=0.0.0.0:12345
            - --storage.path=/var/lib/alloy/data
            - /etc/alloy/config.alloy
          envFrom:
            - configMapRef:
                name: monitoring-env
                optional: false
          volumeMounts:
            - name: config
              mountPath: /etc/alloy
            - name: logs
              mountPath: /var/log
            - name: proc
              mountPath: /host/proc
              readOnly: true
            - name: sys
              mountPath: /host/sys
              readOnly: true
            - name: root
              mountPath: /host/root
              readOnly: true
      volumes:
        - name: config
          configMap:
            name: alloy-config
        - name: logs
          hostPath:
            path: /var/log
        - name: proc
          hostPath:
            path: /proc
        - name: sys
          hostPath:
            path: /sys
        - name: root
          hostPath:
            path: /
3.4 Visualization: Grafana
We deployed Grafana with pre-loaded dashboards via ConfigMaps.
Key Dashboards Created:
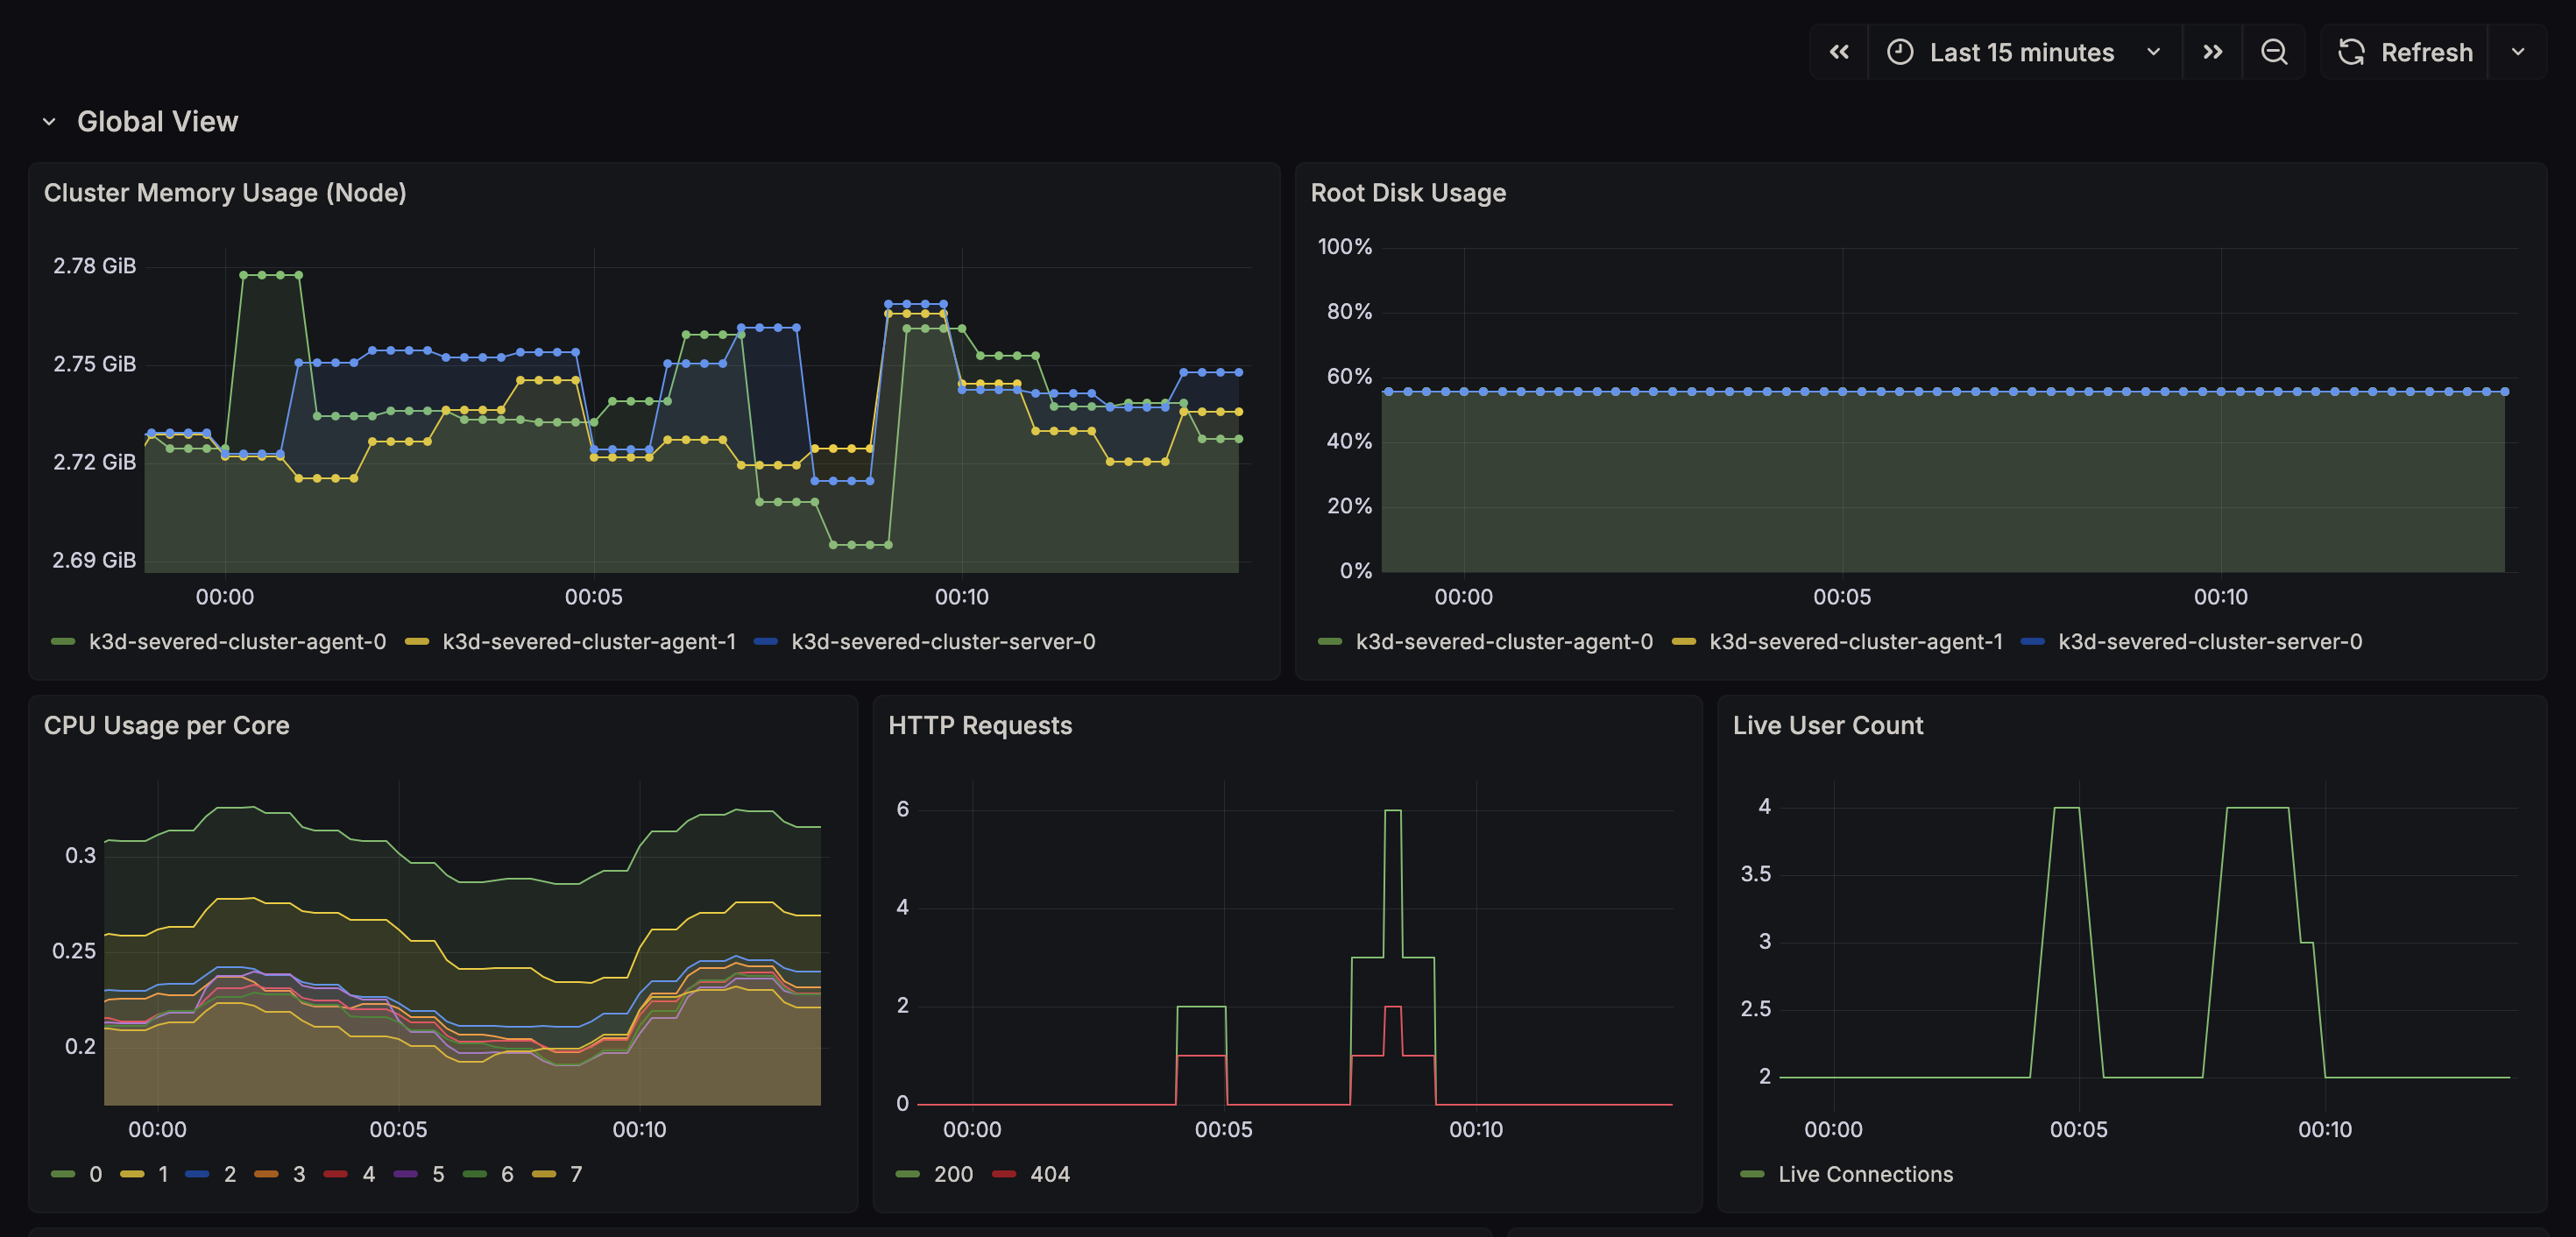
- Cluster Health: CPU/Memory saturation.
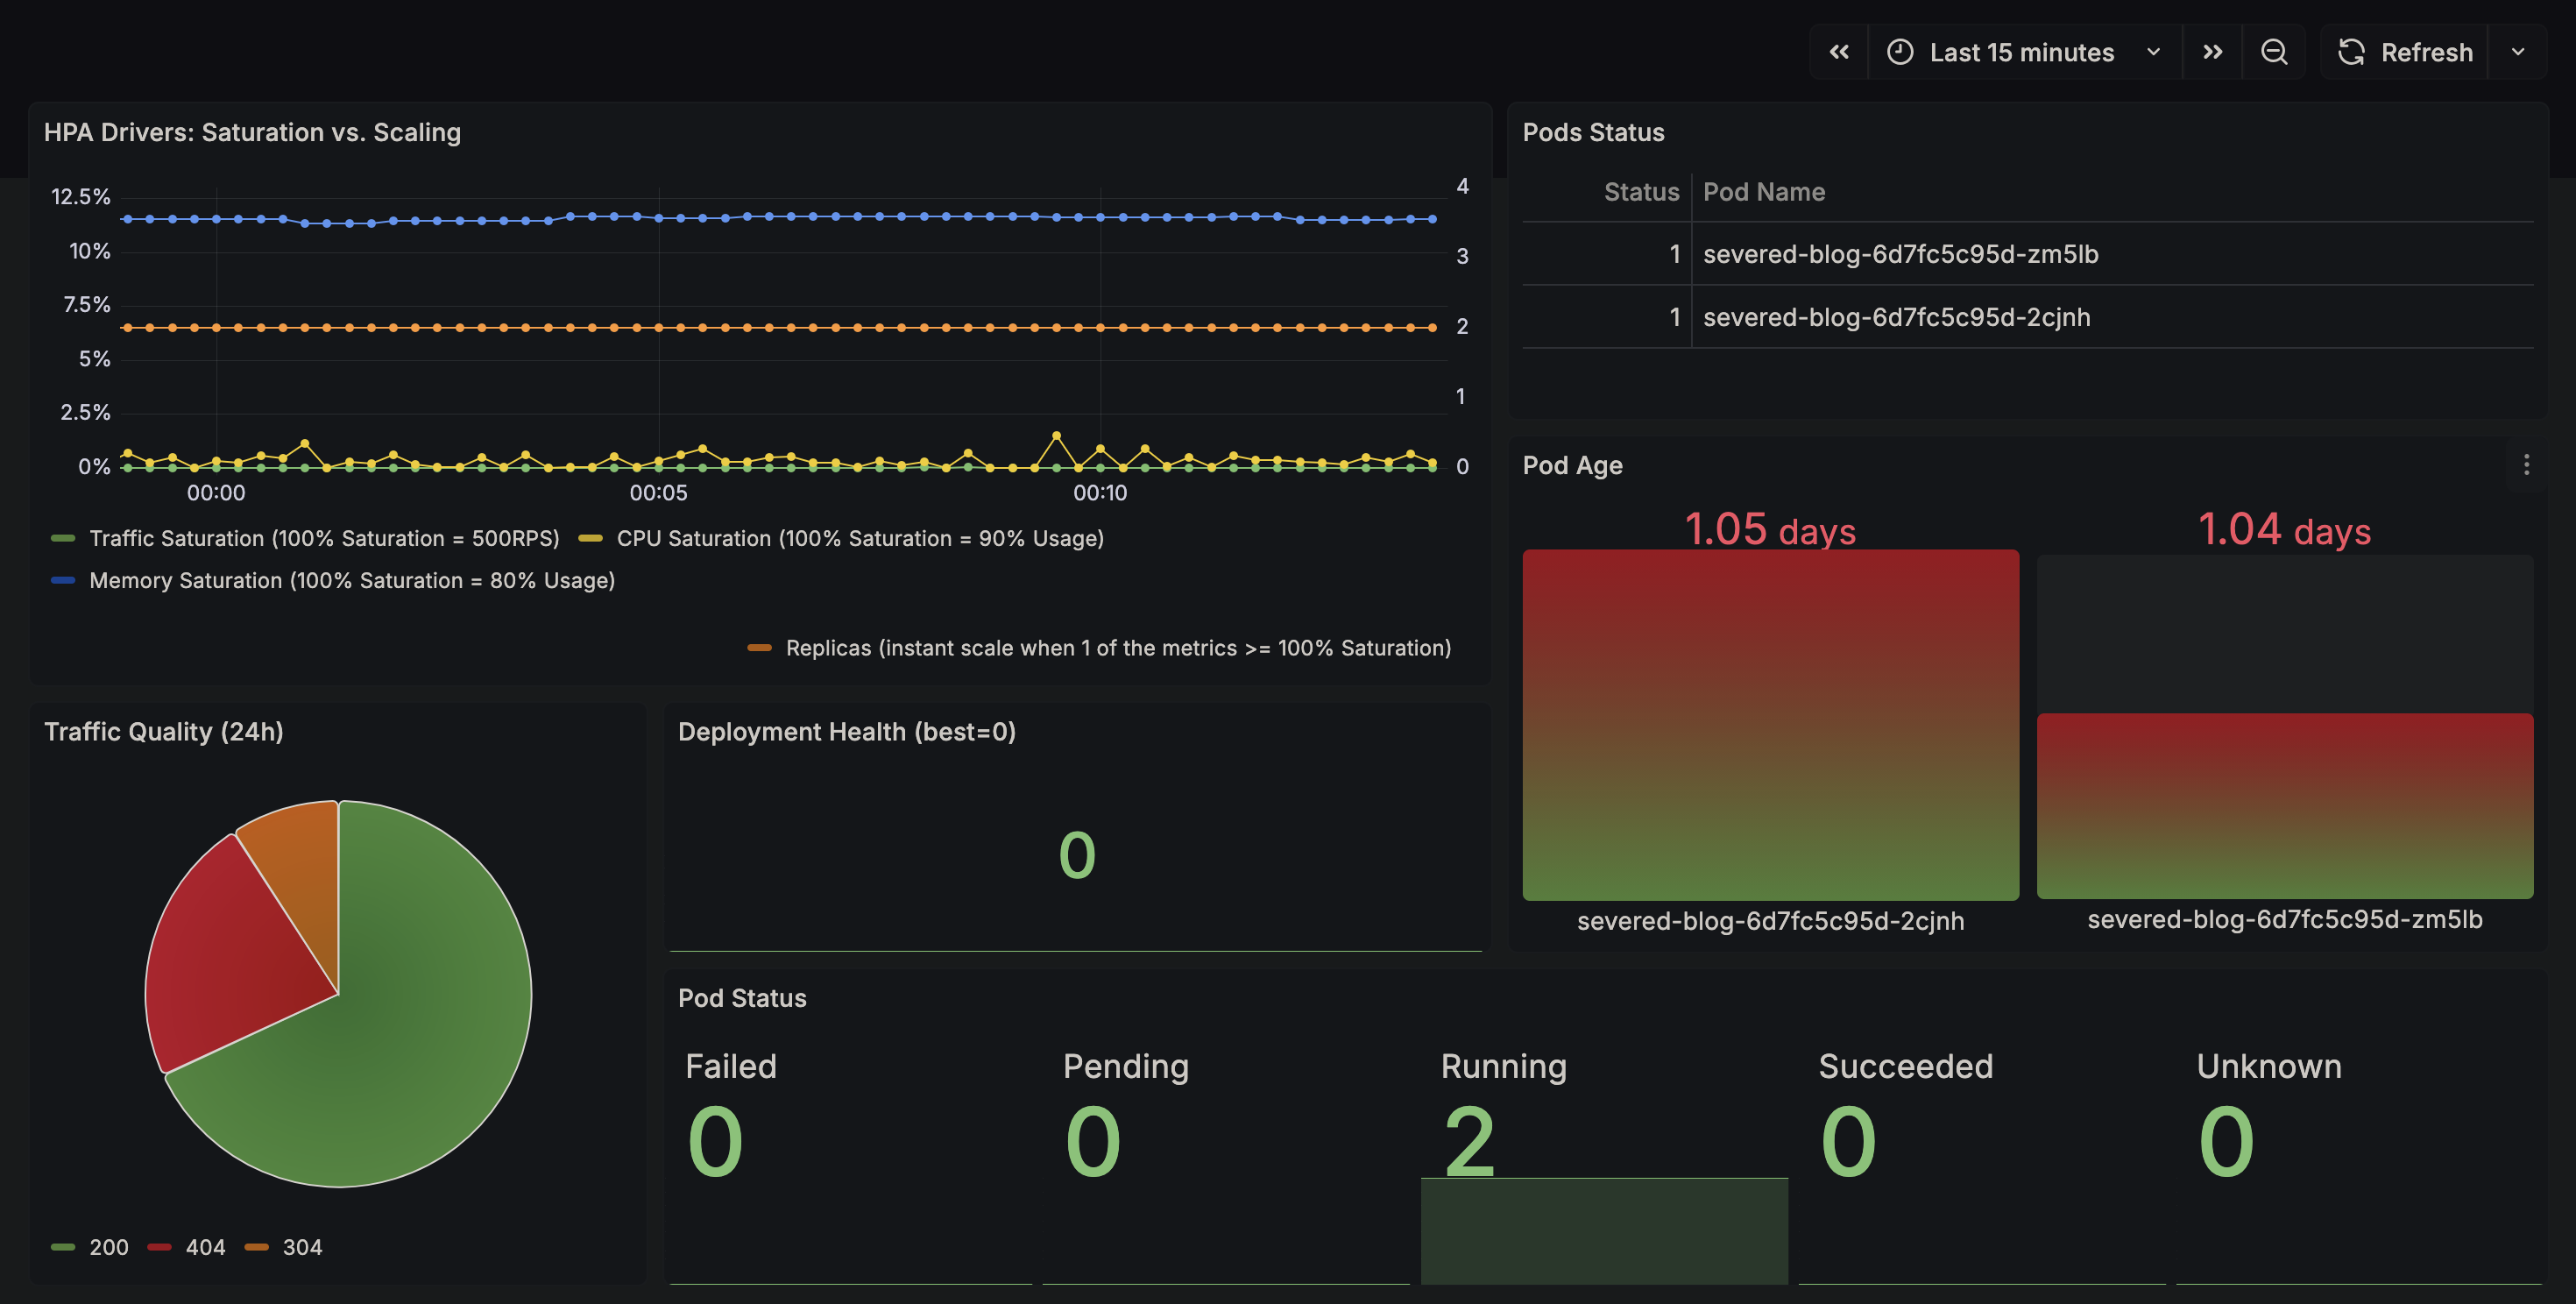
- HPA Live Status: A custom table showing the real scaling drivers (RPS, CPU Request %) vs the HPA's reaction.
infra/observer/grafana.yaml
# 1. Datasources (Connection to Loki/Prom)
apiVersion: v1
kind: ConfigMap
metadata:
  name: grafana-datasources
  namespace: monitoring
data:
  datasources.yaml: |
    apiVersion: 1
    datasources:
      - name: Prometheus
        type: prometheus
        access: proxy
        url: http://prometheus.monitoring.svc:9090
        isDefault: false
      - name: Loki
        type: loki
        access: proxy
        url: http://loki.monitoring.svc:3100
        isDefault: true

---
# 2. Dashboard Provider (Tells Grafana to load from /var/lib/grafana/dashboards)
apiVersion: v1
kind: ConfigMap
metadata:
  name: grafana-dashboard-provider
  namespace: monitoring
data:
  dashboard-provider.yaml: |
    apiVersion: 1
    providers:
      - name: 'Severed Dashboards'
        orgId: 1
        folder: ''
        type: file
        disableDeletion: false
        updateIntervalSeconds: 10 # Allow editing in UI, but it resets on restart
        options:
          path: /var/lib/grafana/dashboards

---
# 3. Service
apiVersion: v1
kind: Service
metadata:
  name: grafana-service
  namespace: monitoring
spec:
  type: LoadBalancer
  selector:
    app: grafana
  ports:
    - protocol: TCP
      port: 3000
      targetPort: 3000

---
# 4. Deployment (The App)
apiVersion: apps/v1
kind: Deployment
metadata:
  name: grafana
  namespace: monitoring
spec:
  replicas: 1
  selector:
    matchLabels:
      app: grafana
  template:
    metadata:
      labels:
        app: grafana
    spec:
      containers:
        - name: grafana
          image: grafana/grafana:latest
          ports:
            - containerPort: 3000

          env:
            - name: GF_SECURITY_ADMIN_USER
              valueFrom:
                secretKeyRef:
                  name: grafana-secrets
                  key: admin-user
            - name: GF_SECURITY_ADMIN_PASSWORD
              valueFrom:
                secretKeyRef:
                  name: grafana-secrets
                  key: admin-password

            - name: GF_AUTH_ANONYMOUS_ENABLED
              value: 'true'
            - name: GF_AUTH_ANONYMOUS_ORG_ROLE
              value: 'Viewer'
            - name: GF_AUTH_ANONYMOUS_ORG_NAME
              value: 'Main Org.'

          volumeMounts:
            - name: grafana-datasources
              mountPath: /etc/grafana/provisioning/datasources
            - name: grafana-dashboard-provider
              mountPath: /etc/grafana/provisioning/dashboards
            - name: grafana-dashboards-json
              mountPath: /var/lib/grafana/dashboards
            - name: grafana-storage
              mountPath: /var/lib/grafana
      volumes:
        - name: grafana-datasources
          configMap:
            name: grafana-datasources
        - name: grafana-dashboard-provider
          configMap:
            name: grafana-dashboard-provider
        - name: grafana-dashboards-json
          configMap:
            name: grafana-dashboards-json
        - name: grafana-storage
          emptyDir: {}
In the Deployment above, you see references to grafana-secrets. However, this file is not in our git repository.
- name: GF_SECURITY_ADMIN_PASSWORD
  valueFrom:
    secretKeyRef:
      name: grafana-secrets # <--- where is this?
      key: admin-password
We don't commit it to version control. In our deploy-all.sh script, we generate this secret imperatively using kubectl create secret generic. In a real production environment, we would use tools like ExternalSecrets or SealedSecrets to inject these safely.
dashboard-json.yaml
apiVersion: v1
kind: ConfigMap
metadata:
  name: grafana-dashboards-json
  namespace: monitoring
data:
  severed-health.json: |
    ...
Just like our blog, we need an Ingress to access Grafana. Notice we map a different hostname (grafana.localhost) to the Grafana service port (3000).
infra/observer/grafana-ingress.yaml
apiVersion: networking.k8s.io/v1
kind: Ingress
metadata:
  name: grafana-ingress
  namespace: monitoring
  annotations:
    traefik.ingress.kubernetes.io/router.entrypoints: web
spec:
  rules:
    - host: grafana.localhost
      http:
        paths:
          - path: /
            pathType: Prefix
            backend:
              service:
                name: grafana-service # ...send them to Grafana
                port:
                  number: 3000
This is how the grafana UI should look like. Notice that we are not signed in.

