# Severed Blog
## Introduction
We are taking a simple static website, the **Severed Blog**, and engineering a production-grade infrastructure around
it.
Anyone can run `docker run nginx`. The real engineering challenge is building the **platform** that keeps that
application alive, scalable, and observable.
In this project, we utilize **K3d** (Kubernetes in Docker) to mimic a real cloud environment locally. Beyond simple
deployment, we implement:
* **High Availability:** Running multiple replicas so the site never goes down.
* **Auto-Scaling:** Automatically detecting traffic spikes (RPS) and launching new pods.
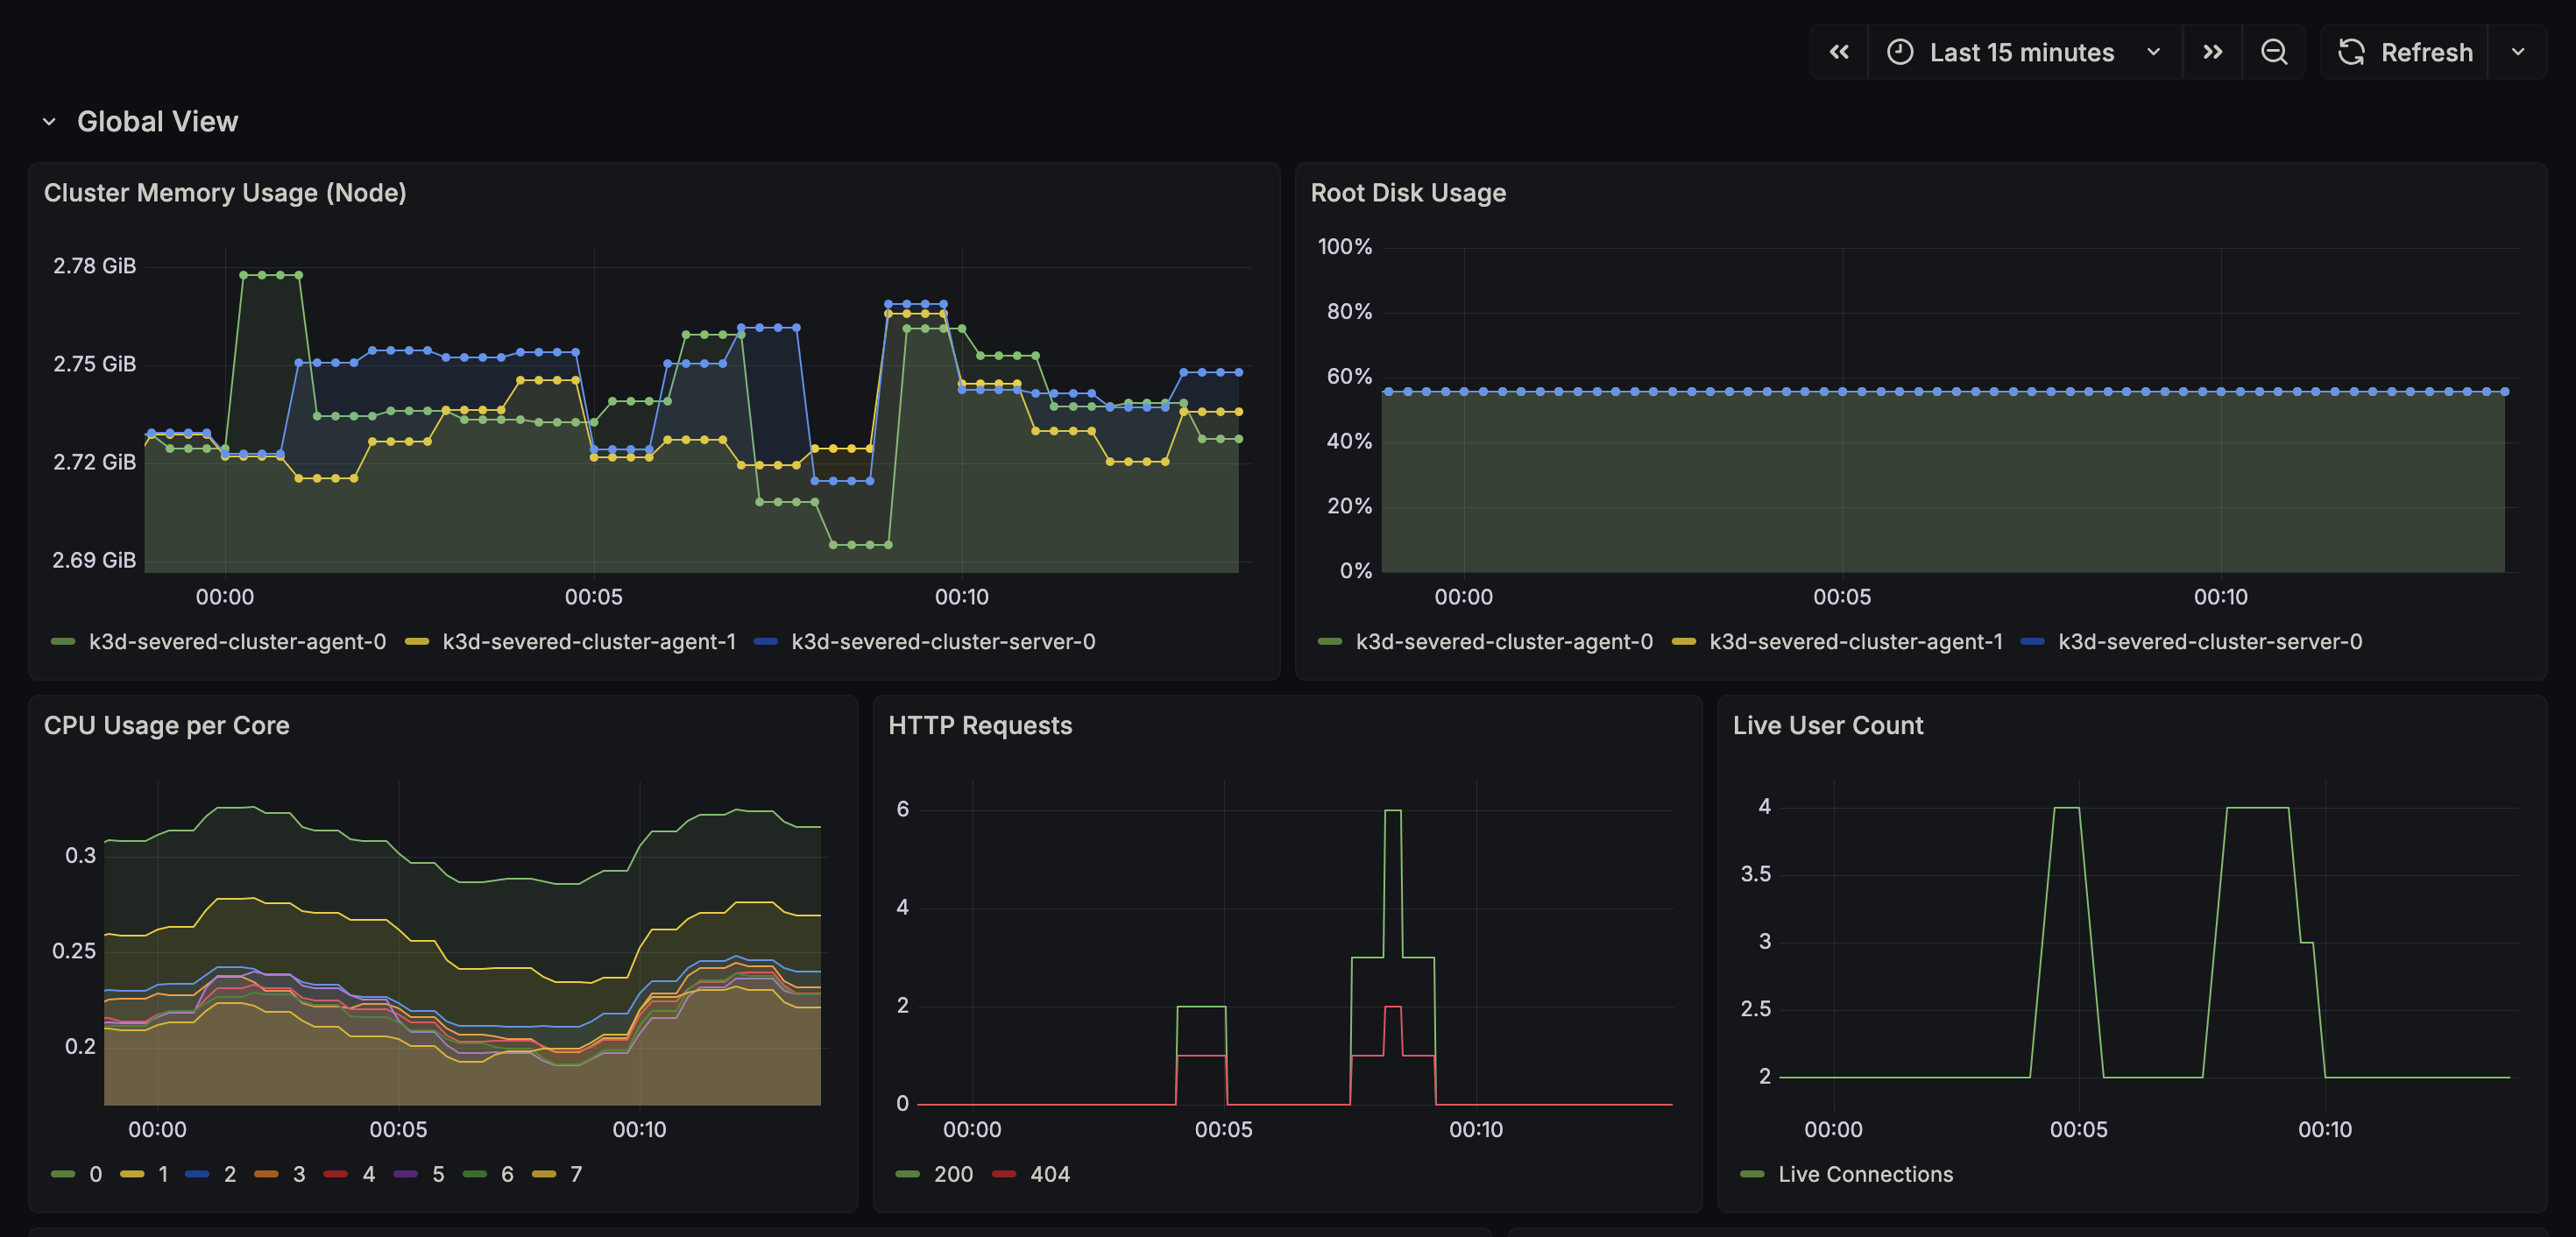
* **Observability:** Using the LGTM stack (Loki, Grafana, Prometheus) to visualize exactly what is happening inside the
cluster.
* **Persistence:** Dynamic storage provisioning for databases using OpenEBS.
## Architecture
The stack is designed to represent a modern, cloud-native environment.
* **Cluster:** K3d (Lightweight Kubernetes).
* **Ingress:** Traefik (Routing `*.localhost` domains).
* **Storage:** OpenEBS (Local PV provisioner for Prometheus/Loki persistence).
* **Application:**
* **Workload:** Nginx serving static assets.
* **Sidecar:** Prometheus Exporter for scraping Nginx metrics.
* **Scaling:** HPA driven by Custom Metrics (Requests Per Second).
* **Observability (LGTM):**
* **Loki:** Log Aggregation.
* **Prometheus:** Metric Storage (Scraping Kube State Metrics & Application Sidecars).
* **Grafana:** Stateless UI with dashboards-as-code.
* **Alloy:** OpenTelemetry Collector running as a DaemonSet.
## Repository Structure
```text
Severed-Infra/
├── apps/ # Application Manifests
│ ├── severed-blog.yaml # Deployment (Web + Sidecar)
│ ├── severed-blog-hpa.yaml # Auto-Scaling Rules (CPU/RAM/RPS)
│ ├── severed-blog-config.yaml # Nginx ConfigMap
│ └── severed-ingress.yaml # Routing Rules (blog.localhost)
├── infra/ # Infrastructure & Observability
│ ├── alloy-setup.yaml # DaemonSet for Metrics/Logs Collection
│ ├── observer/ # The Observability Stack
│ │ ├── loki.yaml # Log Database
│ │ ├── prometheus.yaml # Metric Database
│ │ ├── adapter-values.yaml # Custom Metrics Rules (Prometheus Adapter)
│ │ └── grafana.yaml # Dashboard UI
│ └── storage/ # StorageClass Definitions
└── scripts/ # Automation
├── deploy-all.sh # One-click deployment
└── tests/ # Stress testing tools (Apache Bench)
```
## Quick Start
### 1. Prerequisites
Ensure you have the following installed:
* [Docker Desktop](https://www.docker.com/)
* [K3d](https://k3d.io/)
* `kubectl`
* `helm` (Required for Kube State Metrics and Prometheus Adapter)
### 2. Deploy
We have automated the bootstrap process. The `deploy-all.sh` script handles cluster creation, Helm chart installation,
and manifest application.
```bash
cd scripts
./deploy-all.sh
```
### 3. Verify
Once the script completes, check the status of your pods:
```bash
kubectl get pods -A
```
## Access Points
| Service | URL | Credentials |
|-------------------|------------------------------------------------------------------------------------------------|-----------------------------------------------|
| **Severed Blog** | [http://blog.localhost:8080](https://www.google.com/search?q=http://blog.localhost:8080) | Public |
| **Grafana** | [http://grafana.localhost:8080](https://www.google.com/search?q=http://grafana.localhost:8080) | **User:** `admin`
**Pass:** `admin` |
| **K8s Dashboard** | `https://localhost:8443` | Requires Token (See below) |
To retrieve the K8s Dashboard Admin Token:
```bash
kubectl -n kubernetes-dashboard get secret admin-user-token -o jsonpath={".data.token"} | base64 -d
```
## Highlights
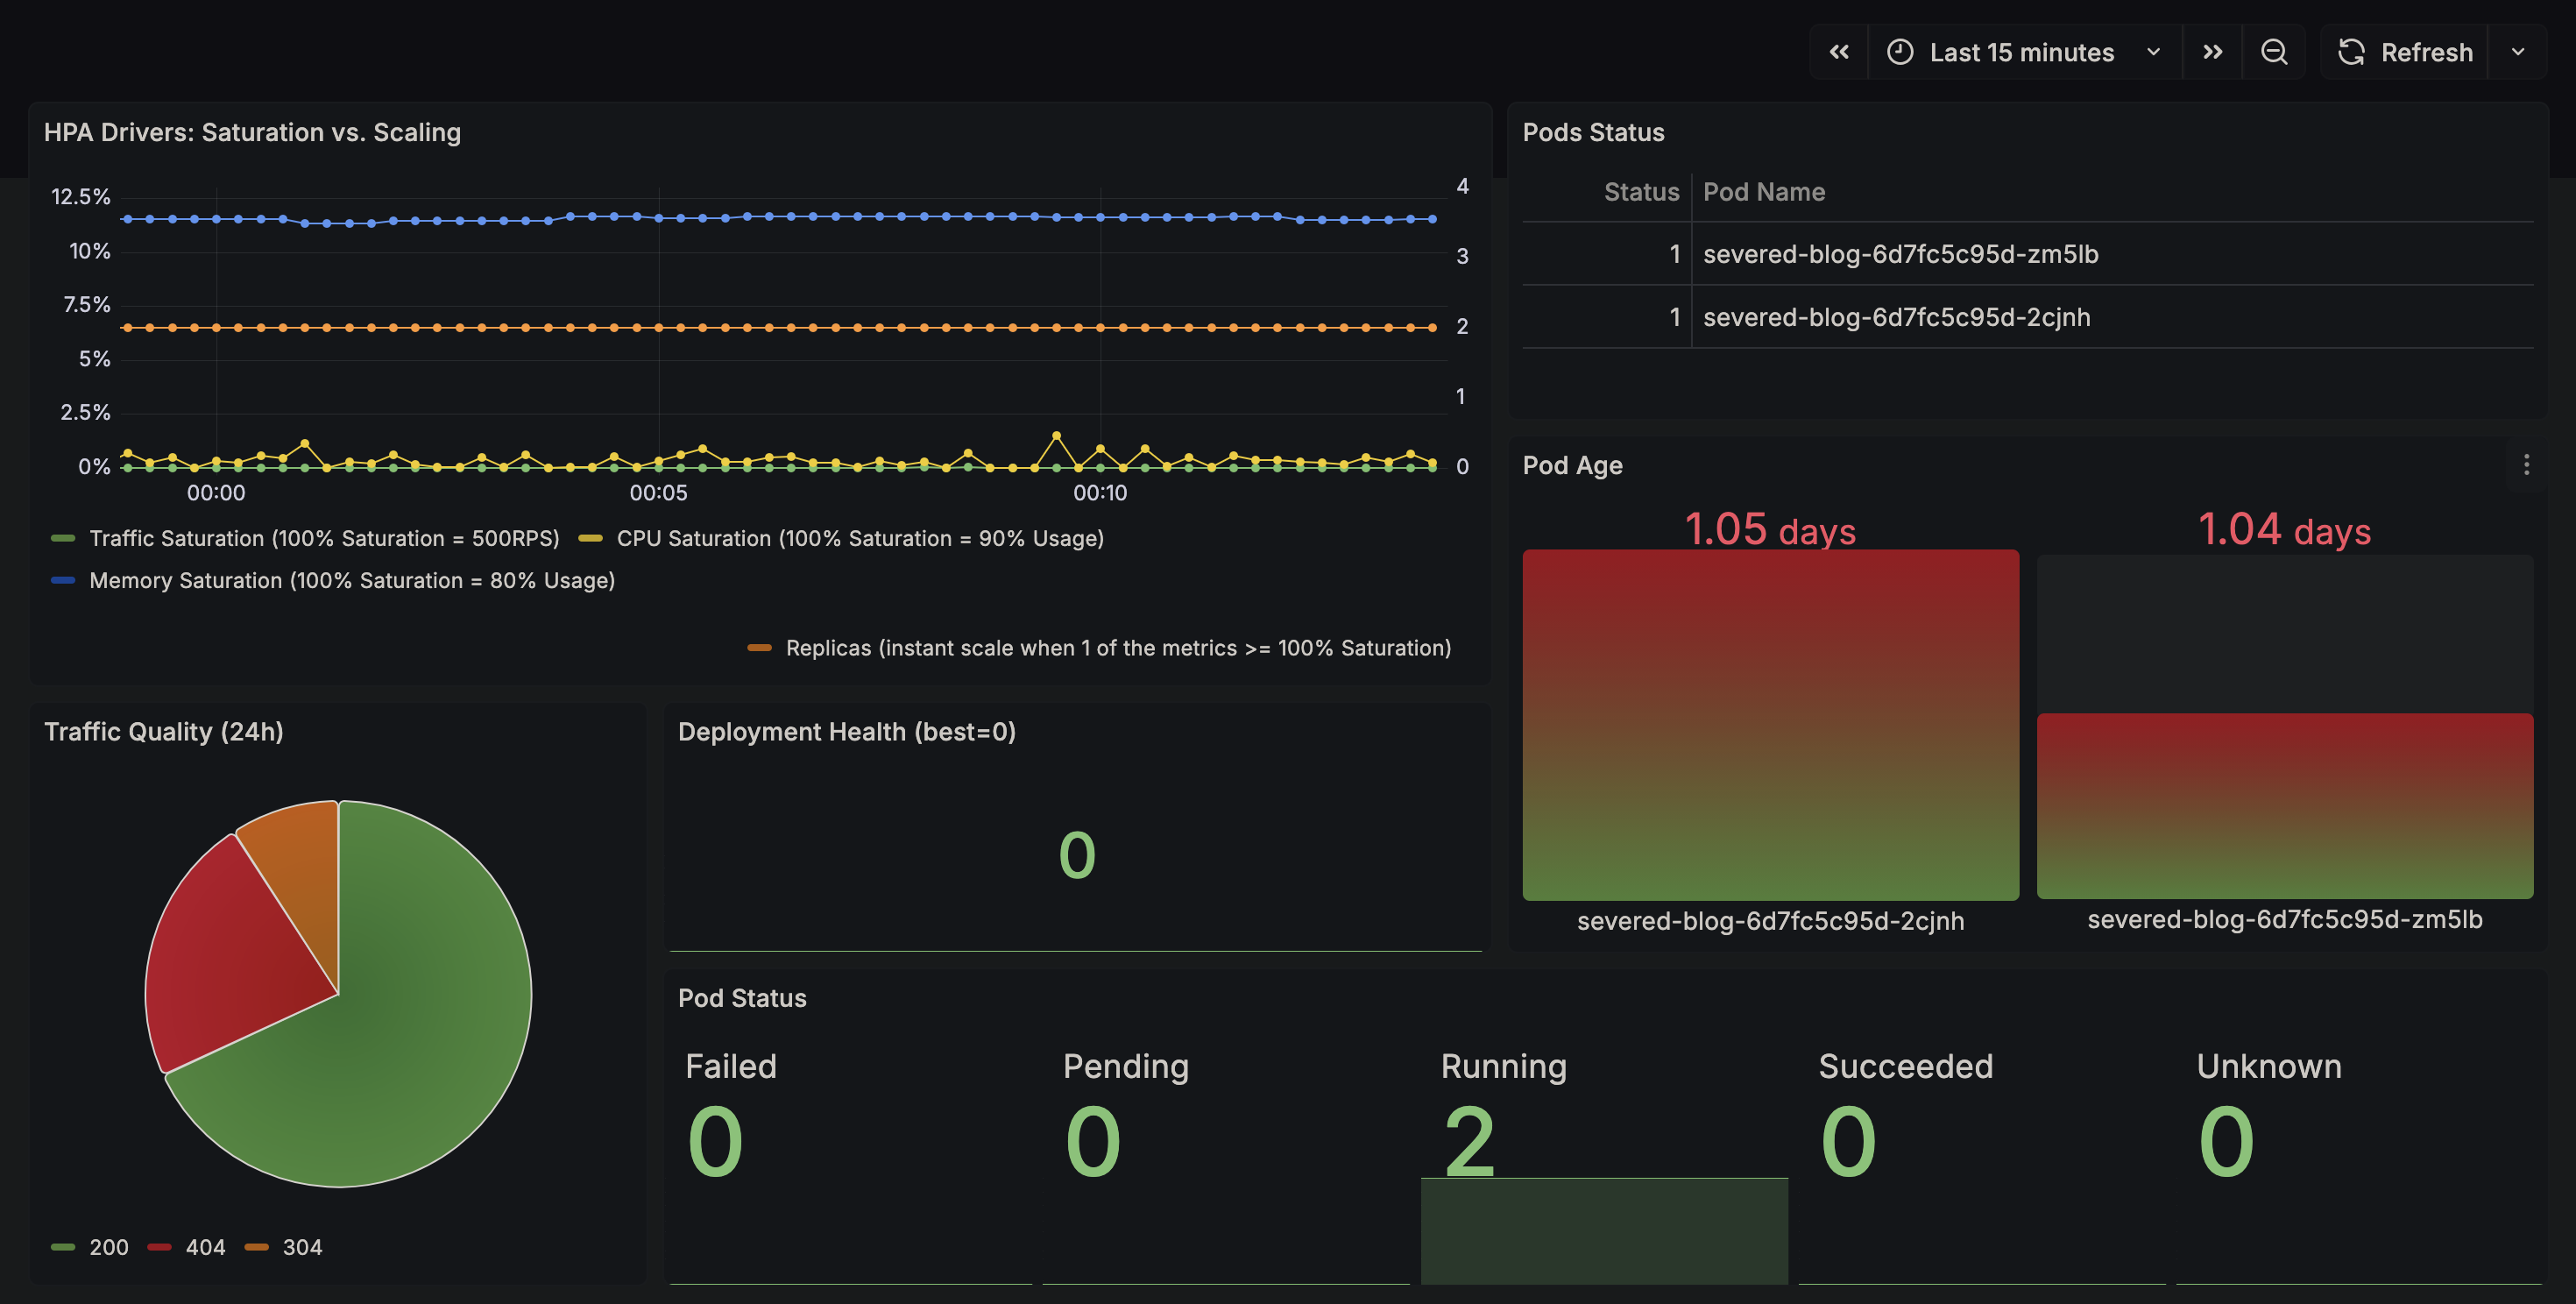
### Auto-Scaling (HPA)
We implemented a custom **Horizontal Pod Autoscaler**.
* **Metrics:** `nginx_http_requests_total`, cpu usage, ram usage
* **Pipeline:** Sidecar Exporter -> Prometheus -> Prometheus Adapter -> Custom Metrics API -> HPA Controller.
* **Behavior:** Scales up max 1 pod every 15s to prevent thrashing; stabilizes for 30s before scaling down.
### Observability
* **Dashboards-as-Code:** Grafana dashboards are injected via ConfigMaps. If the pod restarts, the dashboards persist.
* **Log Correlation:** Alloy enriches logs with Kubernetes metadata (Namespace, Pod Name), allowing us to filter logs by
`app=severed-blog` instead of container IDs.
## Testing
To verify the auto-scaling capabilities, run the stress test script. This uses Apache Bench (`ab`) to generate massive
concurrency.
```bash
# Triggers the HPA to scale from 2 -> 6 replicas
cd scripts/tests
./stress-blog.sh
```
Watch the scaling happen in real-time:
```bash
kubectl get hpa -n severed-apps -w
```
This is how the grafana UI should look like. Notice that we are not signed in.