Severed Blog
Introduction
We are taking a simple static website, the Severed Blog, and engineering a production-grade infrastructure around it.
Anyone can run docker run nginx. The real engineering challenge is building the platform that keeps that
application alive, scalable, and observable.
In this project, we utilize K3d (Kubernetes in Docker) to mimic a real cloud environment locally. Beyond simple deployment, we implement:
- High Availability: Running multiple replicas so the site never goes down.
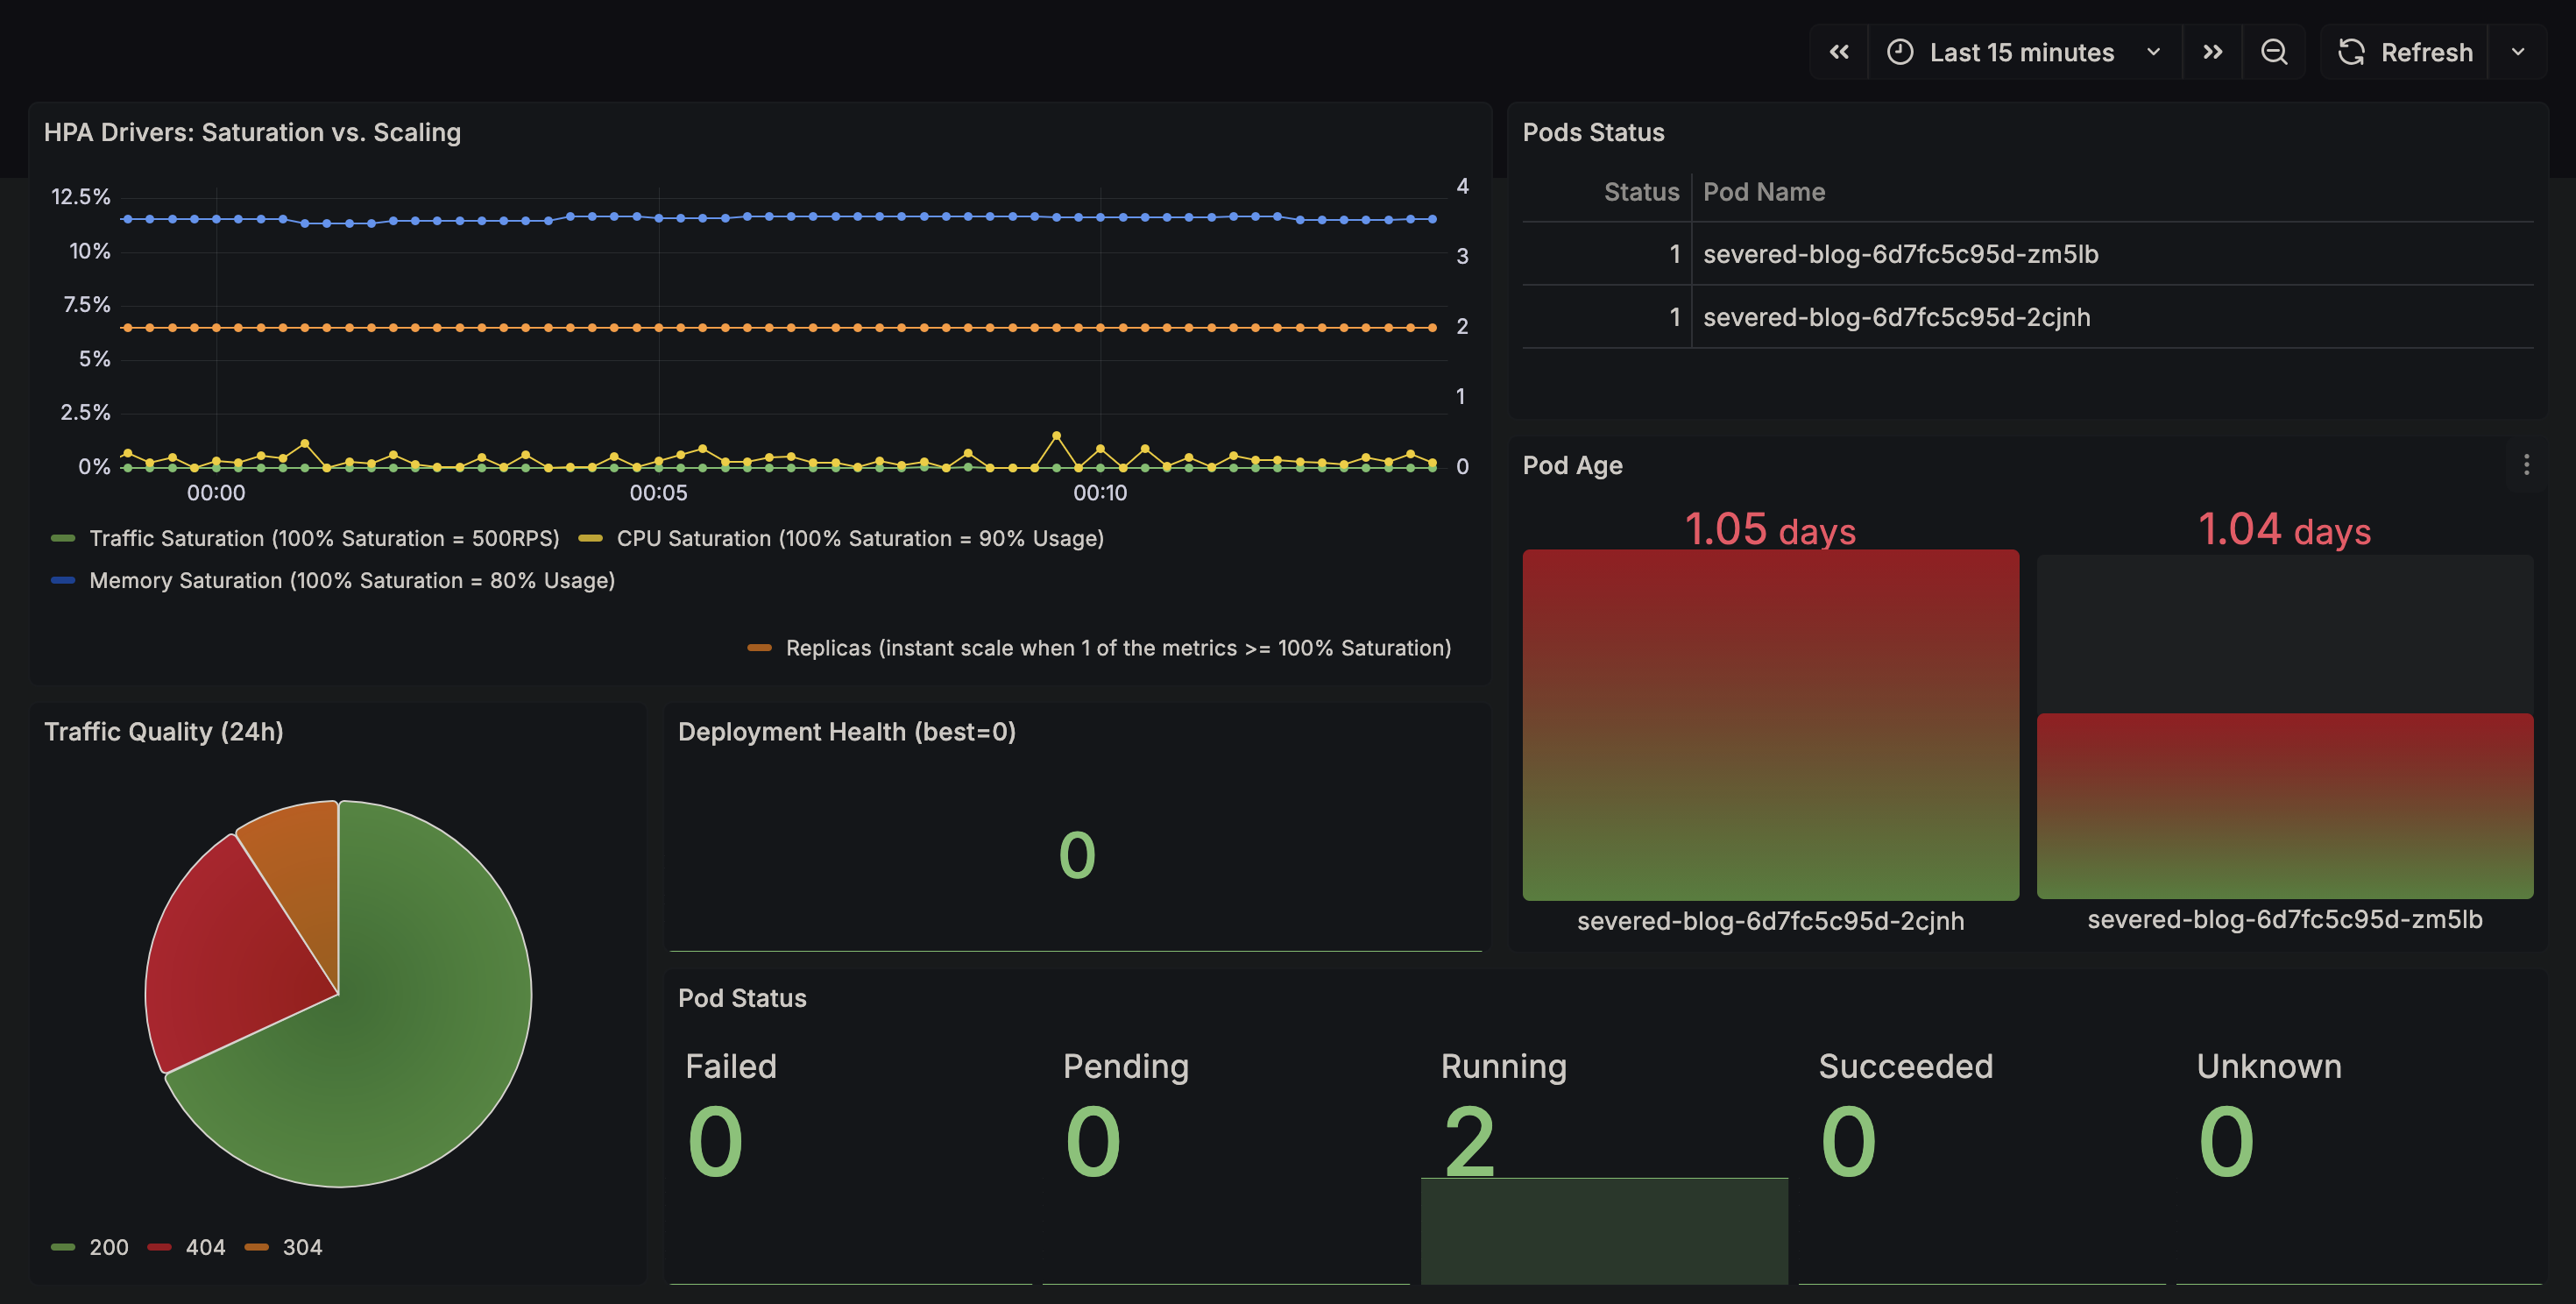
- Auto-Scaling: Automatically detecting traffic spikes (RPS) and launching new pods.
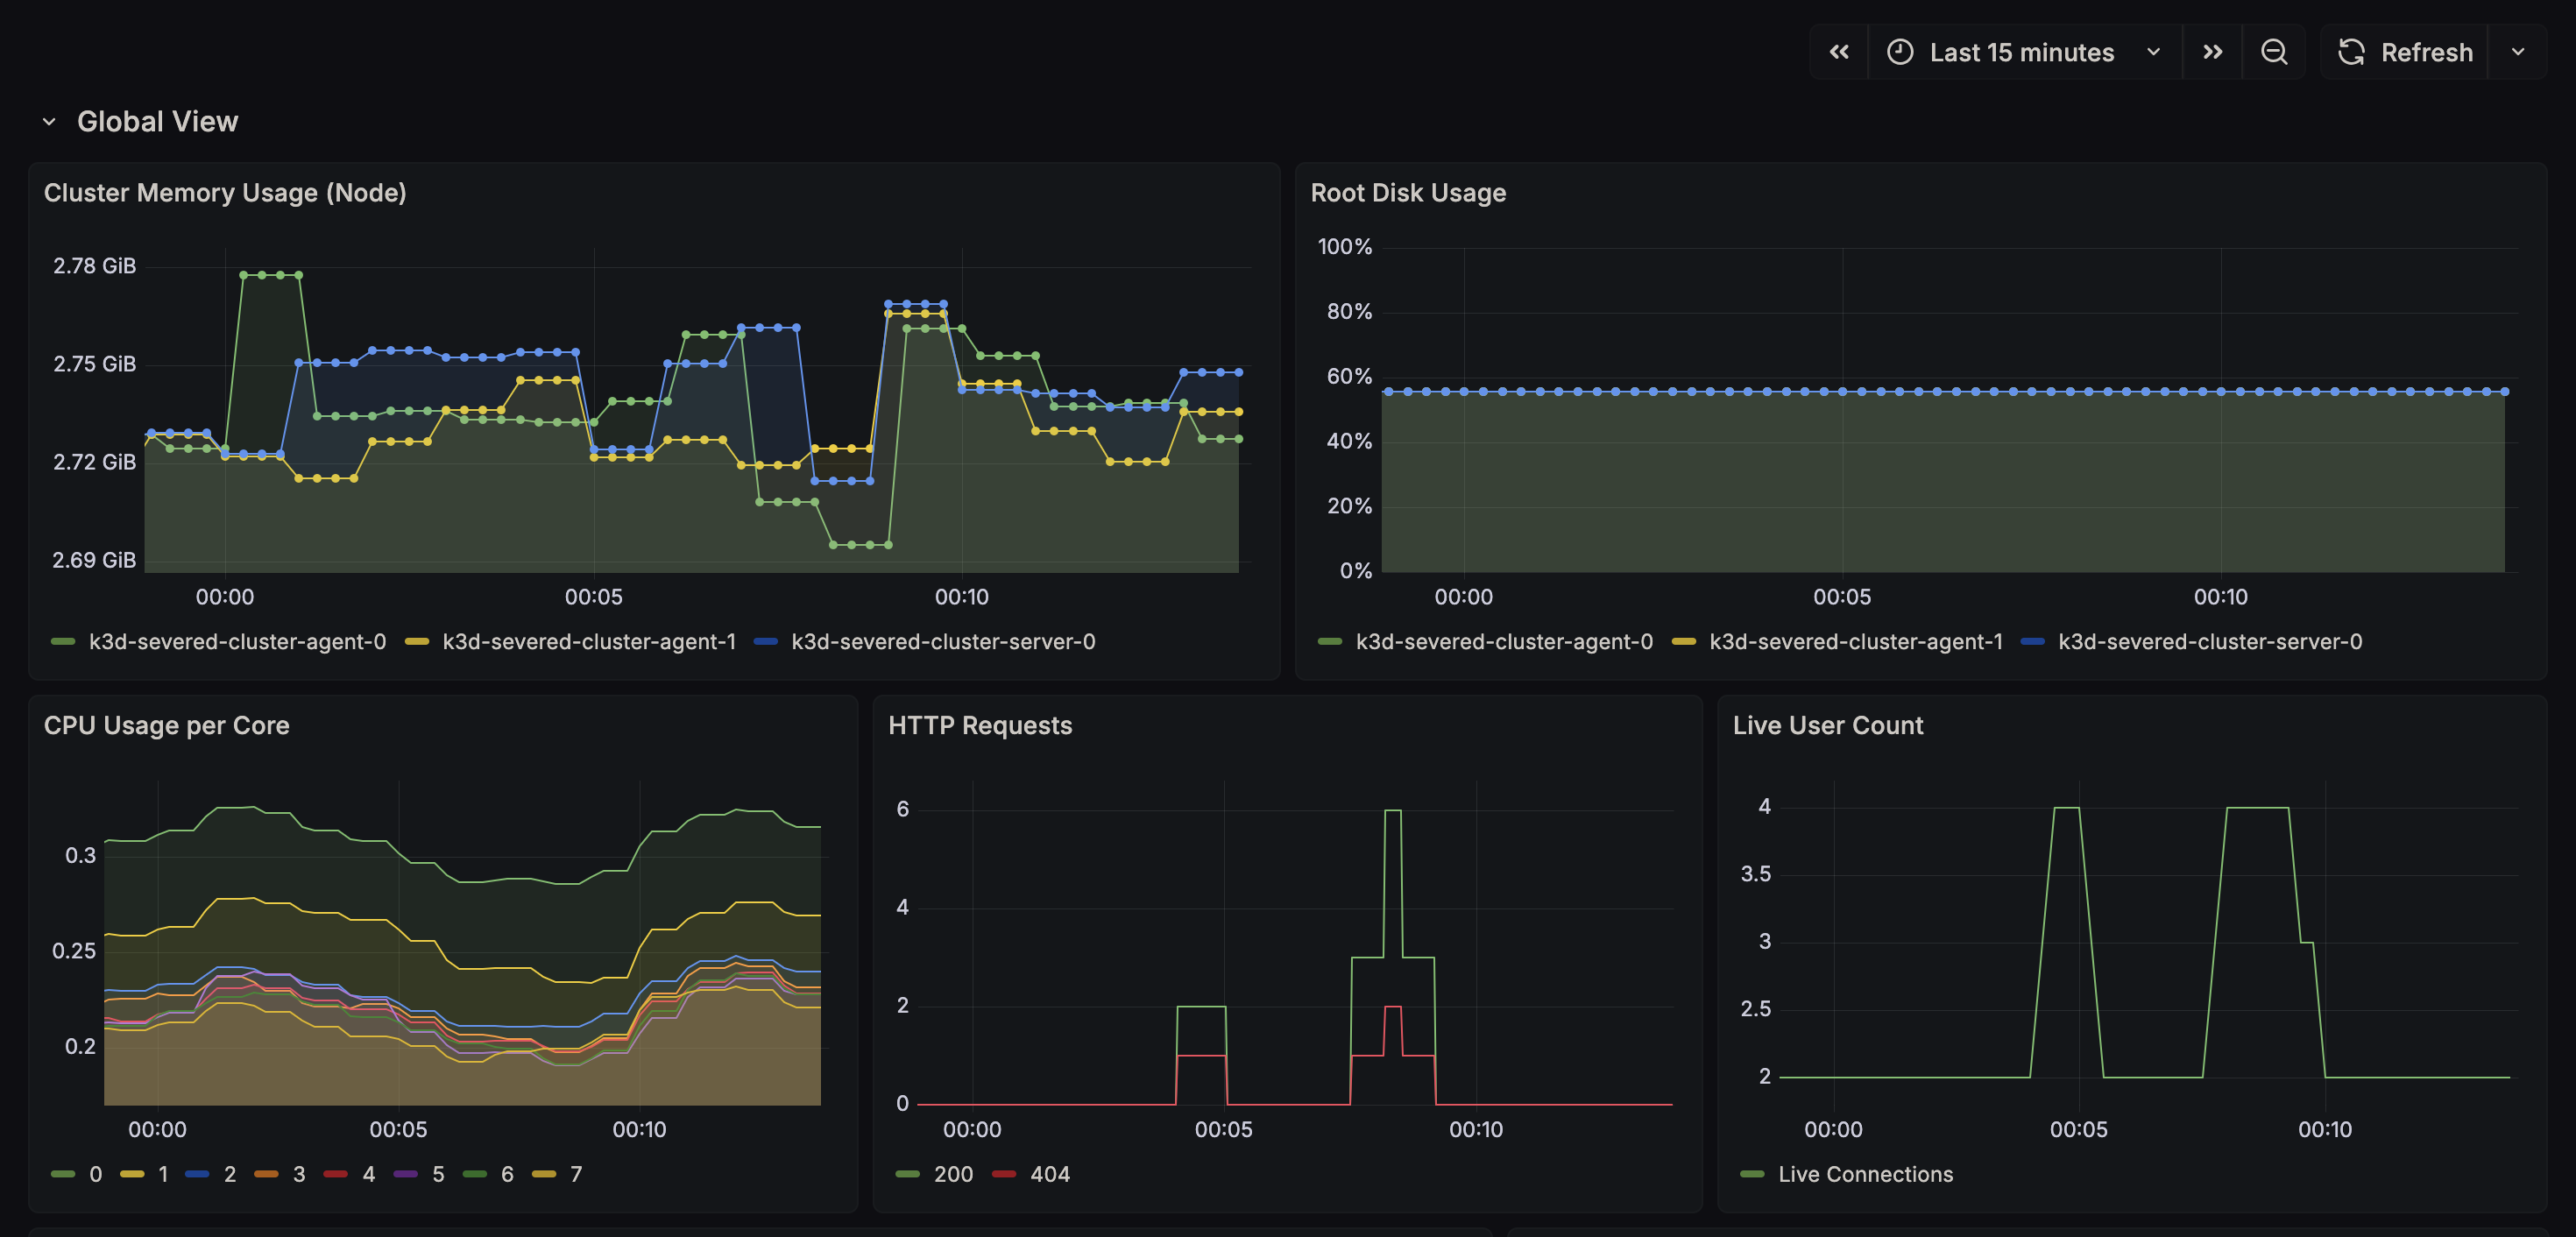
- Observability: Using the LGTM stack (Loki, Grafana, Prometheus) to visualize exactly what is happening inside the cluster.
- Persistence: Dynamic storage provisioning for databases using OpenEBS.
Architecture
The stack is designed to represent a modern, cloud-native environment.
-
Cluster: K3d (Lightweight Kubernetes).
-
Ingress: Traefik (Routing
*.localhostdomains). -
Storage: OpenEBS (Local PV provisioner for Prometheus/Loki persistence).
-
Application:
-
Workload: Nginx serving static assets.
-
Sidecar: Prometheus Exporter for scraping Nginx metrics.
-
Scaling: HPA driven by Custom Metrics (Requests Per Second).
-
Observability (LGTM):
-
Loki: Log Aggregation.
-
Prometheus: Metric Storage (Scraping Kube State Metrics & Application Sidecars).
-
Grafana: Stateless UI with dashboards-as-code.
-
Alloy: OpenTelemetry Collector running as a DaemonSet.
Repository Structure
Severed-Infra/
├── apps/                           # Application Manifests
│   ├── severed-blog.yaml           # Deployment (Web + Sidecar)
│   ├── severed-blog-hpa.yaml       # Auto-Scaling Rules (CPU/RAM/RPS)
│   ├── severed-blog-config.yaml    # Nginx ConfigMap
│   └── severed-ingress.yaml        # Routing Rules (blog.localhost)
├── infra/                          # Infrastructure & Observability
│   ├── alloy-setup.yaml            # DaemonSet for Metrics/Logs Collection
│   ├── observer/                   # The Observability Stack
│   │   ├── loki.yaml               # Log Database
│   │   ├── prometheus.yaml         # Metric Database
│   │   ├── adapter-values.yaml     # Custom Metrics Rules (Prometheus Adapter)
│   │   └── grafana.yaml            # Dashboard UI
│   └── storage/                    # StorageClass Definitions
└── scripts/                        # Automation
    ├── deploy-all.sh               # One-click deployment
    └── tests/                      # Stress testing tools (Apache Bench)
Quick Start
1. Prerequisites
Ensure you have the following installed:
- Docker Desktop
- K3d
kubectlhelm(Required for Kube State Metrics and Prometheus Adapter)
2. Deploy
We have automated the bootstrap process. The deploy-all.sh script handles cluster creation, Helm chart installation,
and manifest application.
cd scripts
./deploy-all.sh
3. Verify
Once the script completes, check the status of your pods:
kubectl get pods -A
Access Points
| Service | URL | Credentials |
|---|---|---|
| Severed Blog | http://blog.localhost:8080 | Public |
| Grafana | http://grafana.localhost:8080 | User: admin Pass: admin |
| K8s Dashboard | https://localhost:8443 |
Requires Token (See below) |
To retrieve the K8s Dashboard Admin Token:
kubectl -n kubernetes-dashboard get secret admin-user-token -o jsonpath={".data.token"} | base64 -d
Highlights
Auto-Scaling (HPA)
We implemented a custom Horizontal Pod Autoscaler.
- Metrics:
nginx_http_requests_total, cpu usage, ram usage - Pipeline: Sidecar Exporter -> Prometheus -> Prometheus Adapter -> Custom Metrics API -> HPA Controller.
- Behavior: Scales up max 1 pod every 15s to prevent thrashing; stabilizes for 30s before scaling down.
Observability
- Dashboards-as-Code: Grafana dashboards are injected via ConfigMaps. If the pod restarts, the dashboards persist.
- Log Correlation: Alloy enriches logs with Kubernetes metadata (Namespace, Pod Name), allowing us to filter logs by
app=severed-bloginstead of container IDs.
Testing
To verify the auto-scaling capabilities, run the stress test script. This uses Apache Bench (ab) to generate massive
concurrency.
# Triggers the HPA to scale from 2 -> 6 replicas
cd scripts/tests
./stress-blog.sh
Watch the scaling happen in real-time:
kubectl get hpa -n severed-apps -w
This is how the grafana UI should look like. Notice that we are not signed in.

